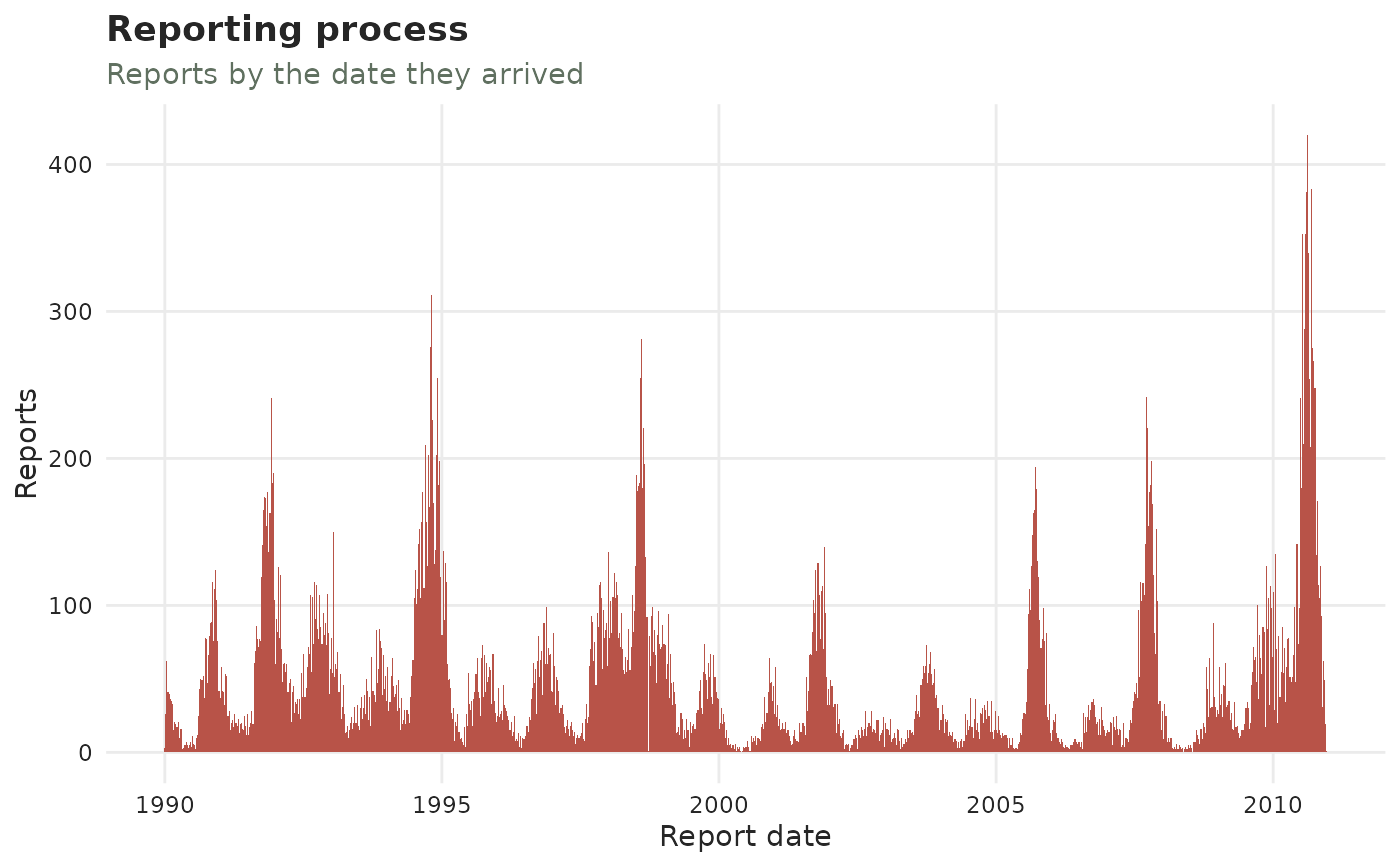
Plot the reporting process
plot_reporting_process.Rd![[Experimental]](figures/lifecycle-experimental.svg)
Arguments
- x
A
tbl_now()object.- plotly
If
TRUE, return an interactive plotly widget (hover, zoom) instead of a static ggplot2 plot. DefaultFALSE.- palette
A named colour palette. Defaults to the package palette.
Details
Shows total reports by report date (when the reports arrived), facetted by stratum when present.