Empirical distribution of the reporting or revision delay
Source:R/plot_effects.R
plot_delay_distribution.Rd![[Stable]](figures/lifecycle-stable.svg)
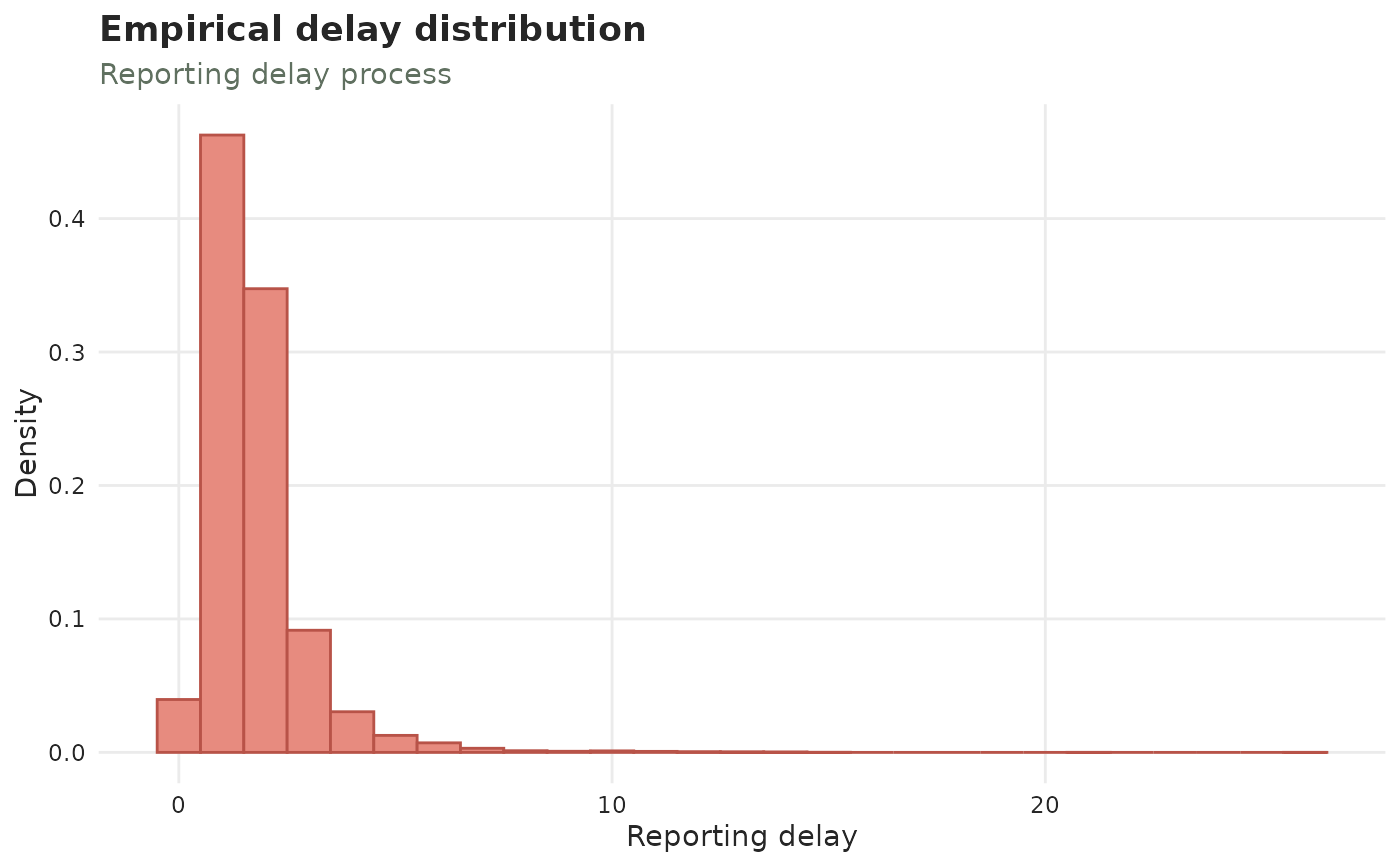
The "delay_distribution" panel of autoplot(), drawn on its own: a
case-count weighted histogram of .delay. For count-cumulative data it
becomes the cumulative growth by delay instead — boxplots, on a log scale,
of the ratio of each event date's cumulative count at a delay to its count at
the previous delay.
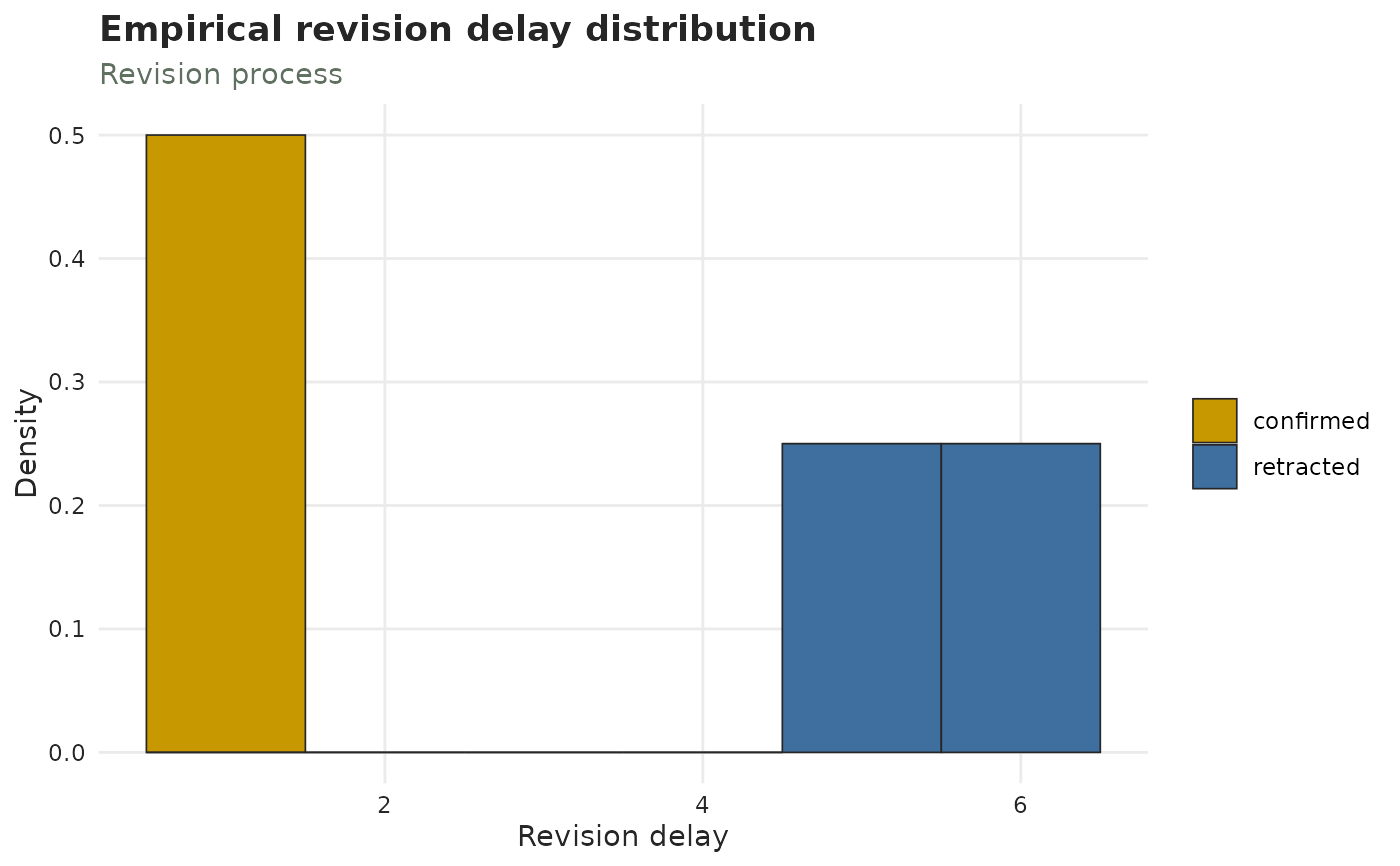
axis = "revision" draws the same histogram of .revision_delay, the time
from a report to its resolution, in the revision process's colours. A case
still "pending" has no resolution, and so no revision delay, and does not
appear.
Usage
plot_delay_distribution(
  x,
  axis = c("report", "revision"),
  by_revision_type = TRUE,
  ...
)
Arguments
- x
A
tbl_now()object.- axis
Which delay to draw:
"report"(default), the time from the event to the report, or"revision", the time from the report to its resolution."revision"needs a revision process (see add_revision_date()).- by_revision_type
Logical (default
TRUE). Split the histogram by how each case eventually resolved —confirmed,pending,retractedandunknown, stacked, in the palette's outcome colours (seetbl_now_palette()). Whether a negative result comes back faster than a positive one is the question the split exists to answer, anddiagnose_revision_delay()is the test of it. Ignored on an object with no revision axis, and whenby_strata = TRUE, which already uses the fill for the strata.- ...
Further arguments passed to
autoplot.tbl_now(), e.g.by_strata,strata,delay_distribution_xlim,plotlyorpalette.
See also
autoplot.tbl_now(), plot_delay_profiles(), plot_delay_drift();
diagnose_revision_delay() for the test behind the outcome split.
Examples
data(denguedat)
dengue_now <- tbl_now(denguedat, onset_week, report_week, verbose = FALSE)
plot_delay_distribution(dengue_now)
 # On the revision axis, split by how each case resolved.
cases <- data.frame(
onset = as.Date("2021-01-04") + rep(0:9, each = 4),
visit = as.Date("2021-01-05") + rep(0:9, each = 4),
result = as.Date("2021-01-05") + rep(0:9, each = 4) +
rep(c(1, 1, 5, 6), times = 10),
outcome = rep(c("confirmed", "confirmed", "retracted", "retracted"), times = 10)
)
flu <- tbl_now(cases,
event_date = onset, report_date = visit,
revision_date = result, revision_type = outcome,
data_type = "linelist", verbose = FALSE
)
plot_delay_distribution(flu, axis = "revision")
# On the revision axis, split by how each case resolved.
cases <- data.frame(
onset = as.Date("2021-01-04") + rep(0:9, each = 4),
visit = as.Date("2021-01-05") + rep(0:9, each = 4),
result = as.Date("2021-01-05") + rep(0:9, each = 4) +
rep(c(1, 1, 5, 6), times = 10),
outcome = rep(c("confirmed", "confirmed", "retracted", "retracted"), times = 10)
)
flu <- tbl_now(cases,
event_date = onset, report_date = visit,
revision_date = result, revision_type = outcome,
data_type = "linelist", verbose = FALSE
)
plot_delay_distribution(flu, axis = "revision")