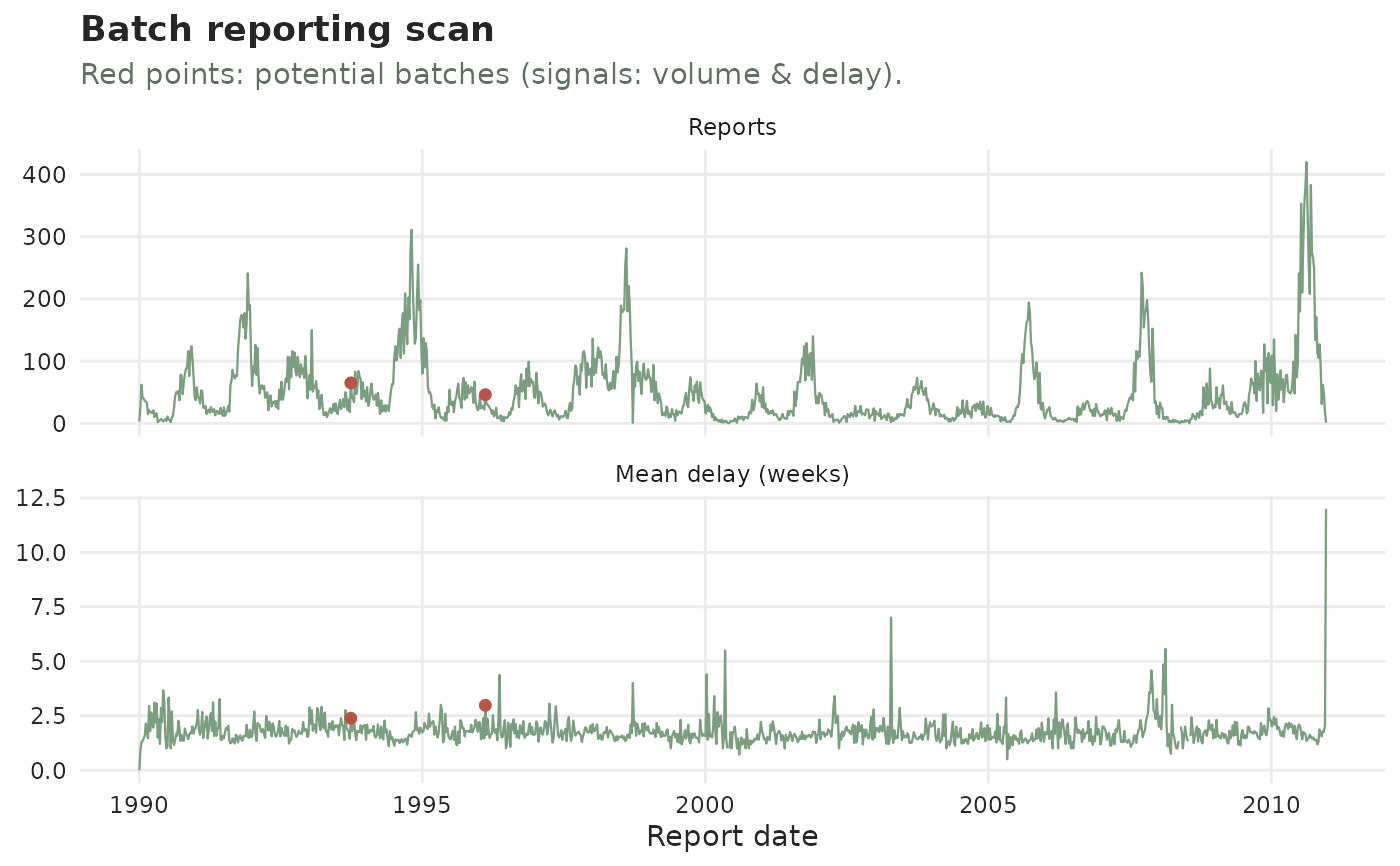
Visualise batch reporting over the report-date axis
plot_report_batches.Rd![[Experimental]](figures/lifecycle-experimental.svg)
Usage
plot_report_batches(
  x,
  ...,
  signals = c("volume", "delay"),
  threshold = 3,
  backlog_delay = NULL,
  backlog_quantile = 0.9,
  baseline_window = NULL,
  gap_window = 3,
  min_reports = 1,
  by_strata = FALSE,
  strata = NULL,
  palette = .tbl_now_palette()
)
Arguments
- x
A
tbl_nowobject.- ...
Unused.
- signals
Character vector of the signals to require (AND-ed). Any of
"volume","delay","span","gap". Defaults toc("volume", "delay").- threshold
Robust-z cutoff a signal must reach to fire (default
3).- backlog_delay
Delay at/above which a report counts as backlog (for the
backlogcolumn).NULL(default) uses thebacklog_quantileof the observed delays.- backlog_quantile
Delay quantile used to set
backlog_delaywhen it isNULL(default0.9).- baseline_window
Rolling-baseline width in report periods.
NULL(default) uses roughly two months.- gap_window
Number of preceding periods assessed by the
"gap"signal (default3).- min_reports
Minimum reports for a period to be eligible (default
1).- by_strata
Logical (default
FALSE). Detect batches separately per stratum.- strata
Character vector of columns to group on when
by_strata = TRUE.NULL(default) uses the object'sstrata.- palette
A named colour palette (defaults to the package palette).
Details
Two stacked panels over the report date: the reporting volume and the
mean reporting delay of each report date, with the batches detected by
detect_report_batches() marked. A batch shows up as a spike in both the
volume and the delay (a backlog of old cases cleared at once), which is what
separates it from an epidemic peak (a volume spike with a normal, short
delay).