![[Stable]](figures/lifecycle-stable.svg)
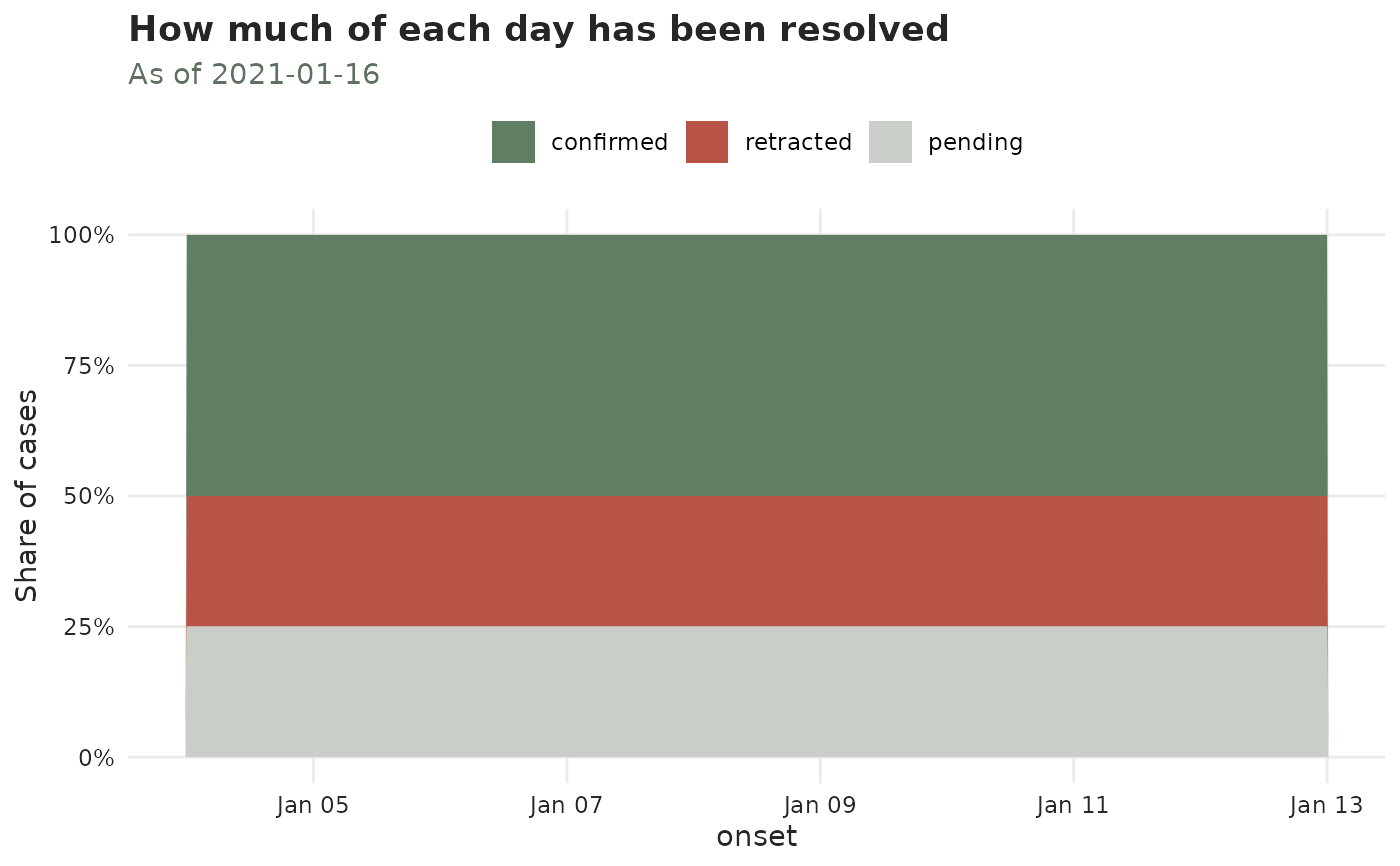
The share of each event date's cases that are confirmed, retracted or
still pending, as of the object's now.
This is the picture of the resolution front. The oldest dates are almost entirely resolved; the most recent ones are mostly pending, because the laboratory has not caught up yet. Where that front sits tells you how far back the confirmed counts can be trusted – and a day that is 80% pending is a day whose confirmed count means very little.
Arguments
- x
A
tbl_nowwith a revision process.- by
Optional stratum column to facet by.
- proportion
When
TRUE(default) the bands are shares summing to 1;FALSEshows the counts instead, which keeps the epidemic curve visible.- palette
A named colour palette (see
tbl_now_palette()). The plot is drawn entirely with stacked areas, so it takes nosizeorlinewidth.
Reading it
The pending band widening towards the right is normal and expected – it is
the same right-truncation a nowcast exists to correct, one axis over. What is
not normal is a pending band that stays wide far from the now: those cases
were reported and then never resolved, and they will never be. Consider
censor_revision_delays_above().
A retracted share that changes over time is worth investigating: it usually
means the testing criteria or the case definition changed, not that the
disease did.
Colours
confirmed is drawn with the palette's epidemic role (it is a real case –
the epidemic process), retracted with reporting (it was removed by the
reporting process), and pending with the neutral pending role (not yet
known either way). Override any of them through palette.
Examples
cases <- data.frame(
  onset = as.Date("2021-01-04") + rep(0:9, each = 4),
  visit = as.Date("2021-01-05") + rep(0:9, each = 4),
  result = as.Date("2021-01-07") + rep(0:9, each = 4),
  outcome = rep(c("confirmed", "confirmed", "retracted", "pending"), times = 10)
)
cases$result[cases$outcome == "pending"] <- as.Date(NA)
flu <- tbl_now(cases,
  event_date = onset, report_date = visit,
  revision_date = result, revision_type = outcome,
  data_type = "linelist", verbose = FALSE
)

plot_revision_status(flu)